
Unlike copper cabling where only one level of certification is defined by standards, there are two levels, or “tiers”, available when certifying fibre optic cabling. The different tiers specify which type of measurements are performed during testing and therefore define the test equipment to be used, known as Tier-1 or Tier-2 certifiers.
Tier-1 certification is a measurement of the total insertion loss (previously called attenuation) of the cabling from one end of the link to the other, whereas Tier-2 certification provides loss information about each component of the link.
An OTDR (optical time domain reflectometer) is used to perform Tier-2 certification. The primary advantage of a Tier-2 test is that it provides information about each connection, splice and cable segment in the link and offers a graphical representation of the components and their performance.
When testing newly installed cabling the report is a snapshot of the system that can be compared to later tests to identify any changes in the cabling. An OTDR is unrivalled for troubleshooting because it shows the operator exactly where faults are located in the cabling, expediting the repair process.
Interpreting OTDR Traces
An OTDR will provide a number of very different looking traces when testing the same fibre depending on the OTDR’s settings for each test. There are three basic OTDR settings that affect the outcome of a test.
Wavelength
Wavelength is the colour of light used to perform the test. The typical test wavelengths used are 850 and 1300nm for multimode fibre and 1310 and 1550nm for singlemode fibre. Other wavelengths can be used for real-time monitoring or for speciality applications/fibre types.
Each wavelength has different attenuation characteristics in a fibre. Short wavelengths (850nm) will have more loss than longer wavelengths (1300nm) in the same length of cable. Additionally, the loss from a bend or kink in the cable depends on the wavelength with shorter wavelengths being less sensitive to bends than longer wavelengths.
Using this knowledge, an experienced technician can use an OTDR to evaluate an event at two different wavelengths to determine whether the loss is due to a bend in the cable (macrobend) or a component like a splice where the loss is not wavelength dependent.
Acquisition Time
This is the amount of time that the OTDR tests a cable. An OTDR trace is not just one single test of the cable, it is an average of hundreds or thousands of tests over a period of time. The longer the OTDR is allowed to run, the more samples it takes. The results are averaged together to present the final trace.
Longer test times result in “cleaner” looking traces because noise is averaged out, leaving a more detailed picture of the fibre and components in the cable under test. Technically speaking the OTDR is lowering the noise floor and increasing the dynamic measurement range of the device, allowing it to provide detailed traces of very long or high-loss cables. The downside to increased dynamic range is reduced productivity due to longer test times. Ideally a technician will determine an acquisition time that provides the necessary trace detail without sacrificing excess time. There is no best test time, it depends on many factors that a technician learns to identify with experience.
Pulse Width
Having the most impact on measurement results, the pulse width is the duration of the laser pulse for each sample during the trace acquisition. A short pulse width provides excellent resolution and can detect events that are near each other at patch panels where there may be just a few feet between connectors. The downside to a short pulse is that it injects a small amount of power into the cabling and cannot measure long distances. In some cases, the OTDR may not be able to detect the end of the cable if there are high loss splitters on the link like those used in PONs (passive optical networks).
Increasing the pulse width will provide more power to measure long cables or “punch” through splitters at the expense of potentially missing connectors or splices in the link. To best test a link, a technician can perform multiple tests, each with a different pulse width so that connectors and splices near the end of the cable can be measured as well as the entire length of the cable for an accurate end-to-end loss measurement.
Compromise
Ultimately, obtaining the perfect, single OTDR trace for a given cable is a matter of compromise that boils down to resolution (sharpness) versus dynamic range (maximum loss that can be measured). In the past, the only work-around was to create multiple reports for each fibre with the OTDR set to different configurations.
One test would be performed with a short pulse width to accurately measure individual connectors near the OTDR and another would be run with a long pulse width to provide enough power to measure through splitters and see all the way to the opposite end of long cables. Then, the same tests are performed at a second wavelength so that macrobends (tight bends or kinks) can be identified and differentiated from splices because the loss of a bend is wavelength dependent where the loss of a splice is not.
Using this method there can be four or more reports for each fibre tested. While this method captures all the information about the various events on the fibre, trying to make sense of it all it all to determine whether the fibre passes or fails is not a trivial task. Not to mention the time it takes to reconfigure the OTDR for each of the different tests which takes a toll on the productivity of high paid technicians.
iOLM Simplifies OTDR Analysis
Intelligent Optical Link Mapping (iOLM) is a technology that automates the process of configuring the OTDR to capture and analyze all the information on a fibre regardless of its length and the number of connectors and splices on the span. Using iOLM, the OTDR will perform multiple tests using different configurations and combine all resulting data into a single report that provides the user with a simple PASS/FAIL result for even the most complex optical links.
While an OTDR with iOLM technology can generate a traditional OTDR trace for those who want it, the key to simplifying OTDR analysis lies in changing the way we look at OTDR test results. Instead of a trace that requires years of field experience to interpret, iOLM generates a linear diagram using easy-to-understand icons to represent connectors, splices, splitters, macrobends and other events on the fibre being tested. This allows a technician with almost no experience operating OTDRs to certify fibre cabling and understand exactly what is happening during each test.
For good cables that pass the desired test standard, each event will be represented by a green icon identifying the type of event and a number above and below the box indicating the distance to and power loss of the event.
Should a test fail, the offending event will be represented by a red icon with the distance and loss, as well as recommendations on how to correct the problem. With iOLM, a technician can quickly and easily identify, locate and correct problems on any fibre link regardless of its complexity.
iOLM vs. OTDR Traces
Below are three different OTDR tests of the same fibre. In this example, it was necessary to test the fibre at three different pulse widths to analyze the connectors at the near end of the cable, a splitter in the middle and finally have enough power to measure the full span of the link. A traditional OTDR cannot capture all the details of this complex optical link with a single test. By comparison, an iOLM-equipped OTDR can perform a complete analysis of the link presented in a simple graphical format with just one press of the Test button.

Figure 1: First OTDR test with short pulse width.
In Figure 1 the first OTDR measurement is made with a short pulse width of 5-10ns allowing the first connector’s loss to be measured and identifying any components up to a splitter in the link. The drop off in power at the 75m point is not the end of the cable as it may appear. It is a splitter with so much loss (as expected) that the short pulse cannot “see” through the splitter.

Figure 2: Second OTDR test with medium pulse width.
The second OTDR measurement shown in Figure 2 is taken with a longer pulse width. This setting provides enough power that the loss of the splitter, event #3, can be measured but there is too much power to measure the loss of the first and second connectors of the link. This setting also reveals another splitter at 180m, yet there is still not enough power to see through the second splitter and measure its loss.

Figure 3: Third OTDR test with long pulse width
Lastly the OTDR is set with an even higher pulse width that is necessary to pass through both splitters and reach all the way to the end of the fibre. Now there is so much power that the initial connectors cannot be seen at all. This test also reveals an event at about 2000m that appears to be a splice. A single wavelength test cannot differentiate a splice from a macrobend, so yet another test at a second wavelength will be required to make that determination.
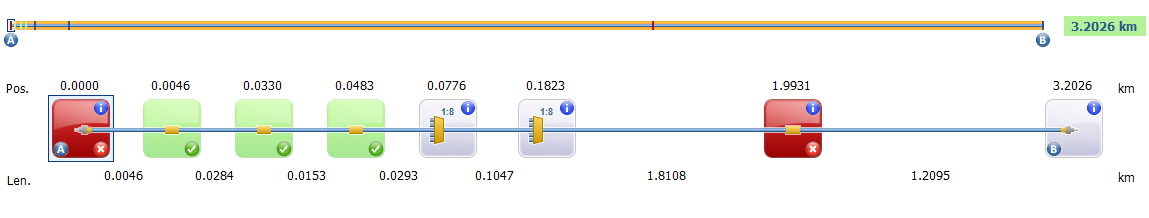
Figure 4: iOLM combines multiple OTDR traces into a single block diagram of the link.
The iOLM diagram, Figure 4, simplifies analysis of the fibre by testing it with multiple configurations and combining the results onto a single intuitive graphic. From left to right the elements of the link map are: a bad connector, three good splices, 2 splitters, a bad splice and finally the end of the cable. The splitters are not red or green because there is no industry standard for splitter loss limits. The loss depends on the type of splitter and the loss value is purely informative. The operator can compare the measured loss to the specifications on the data sheet of the splitter to ensure it is performing properly.
Below are several screenshots from the IDEAL Networks OTDR II with iOLM. By simply touching an element’s icon the details are displayed along with troubleshooting tips.
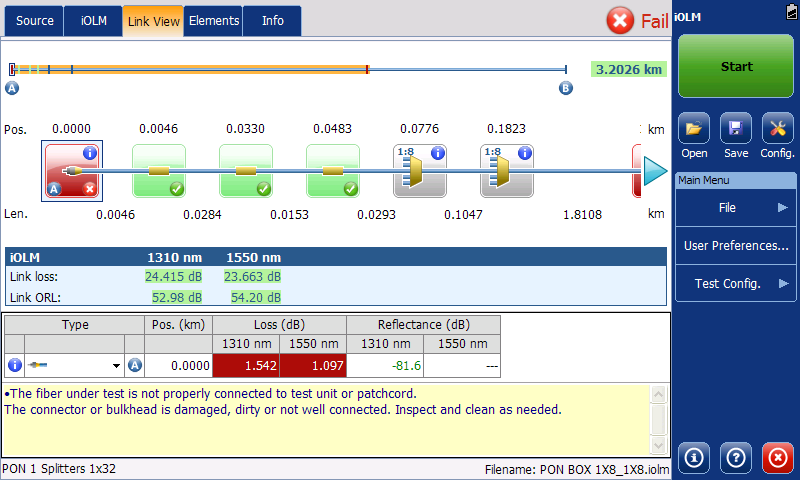
Figure 5: First connector selected - indicated by a blue box surrounding the red icon. This connector is shown in red because it has a loss of 1.542 and 1.097dB (highlighted red text in the table below the iOLM diagram) at 1310 and 1550nm respectively; exceeding the loss limit of 0.750dB.
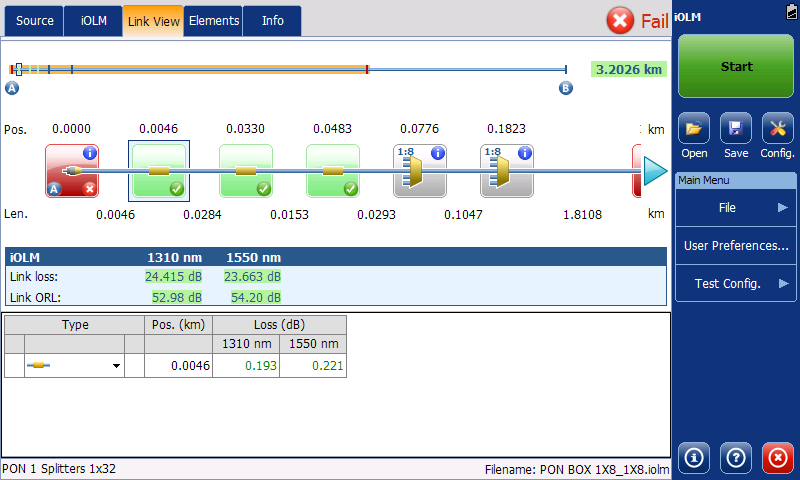
Figure 6: First splice selected. Shown in green because it's loss is less than the allowable 0.300dB. The splice's loss is 0.193 and 0.221dB at 1310 and 1550nm respectively.
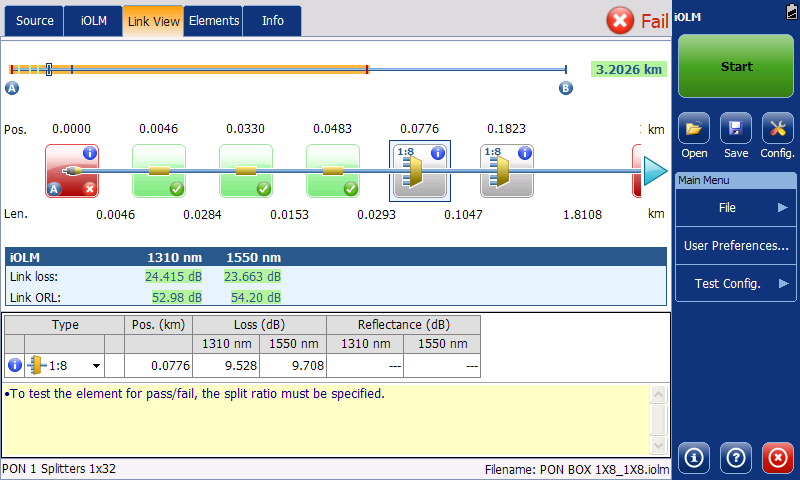
Figure 7: First splitter selected. Shown in grey because there are no pass/fail limits for splitters. Its loss is 9.528 and 9.708dB at 1310 and 1550nm and is shown for information only.
It should be evident that iOLM greatly simplifies Tier 2 OTDR certification and allows technicians with relatively little experience to certify and if necessary, analyze and troubleshoot fibre cabling regardless of the complexity of the link. Further, by testing each link with multiple configurations the OTDR will provide the most accurate reports ensuring that only good links pass and only bad links fail.
The IDEAL Networks OTDR II is an efficient, tablet style OTDR that is handy, lightweight and rugged enough for any working environment. For more information on OTDR II or any of the range of IDEAL Networks cable and network testers, visit www.idealnetworks.net.